Signature Analyzer

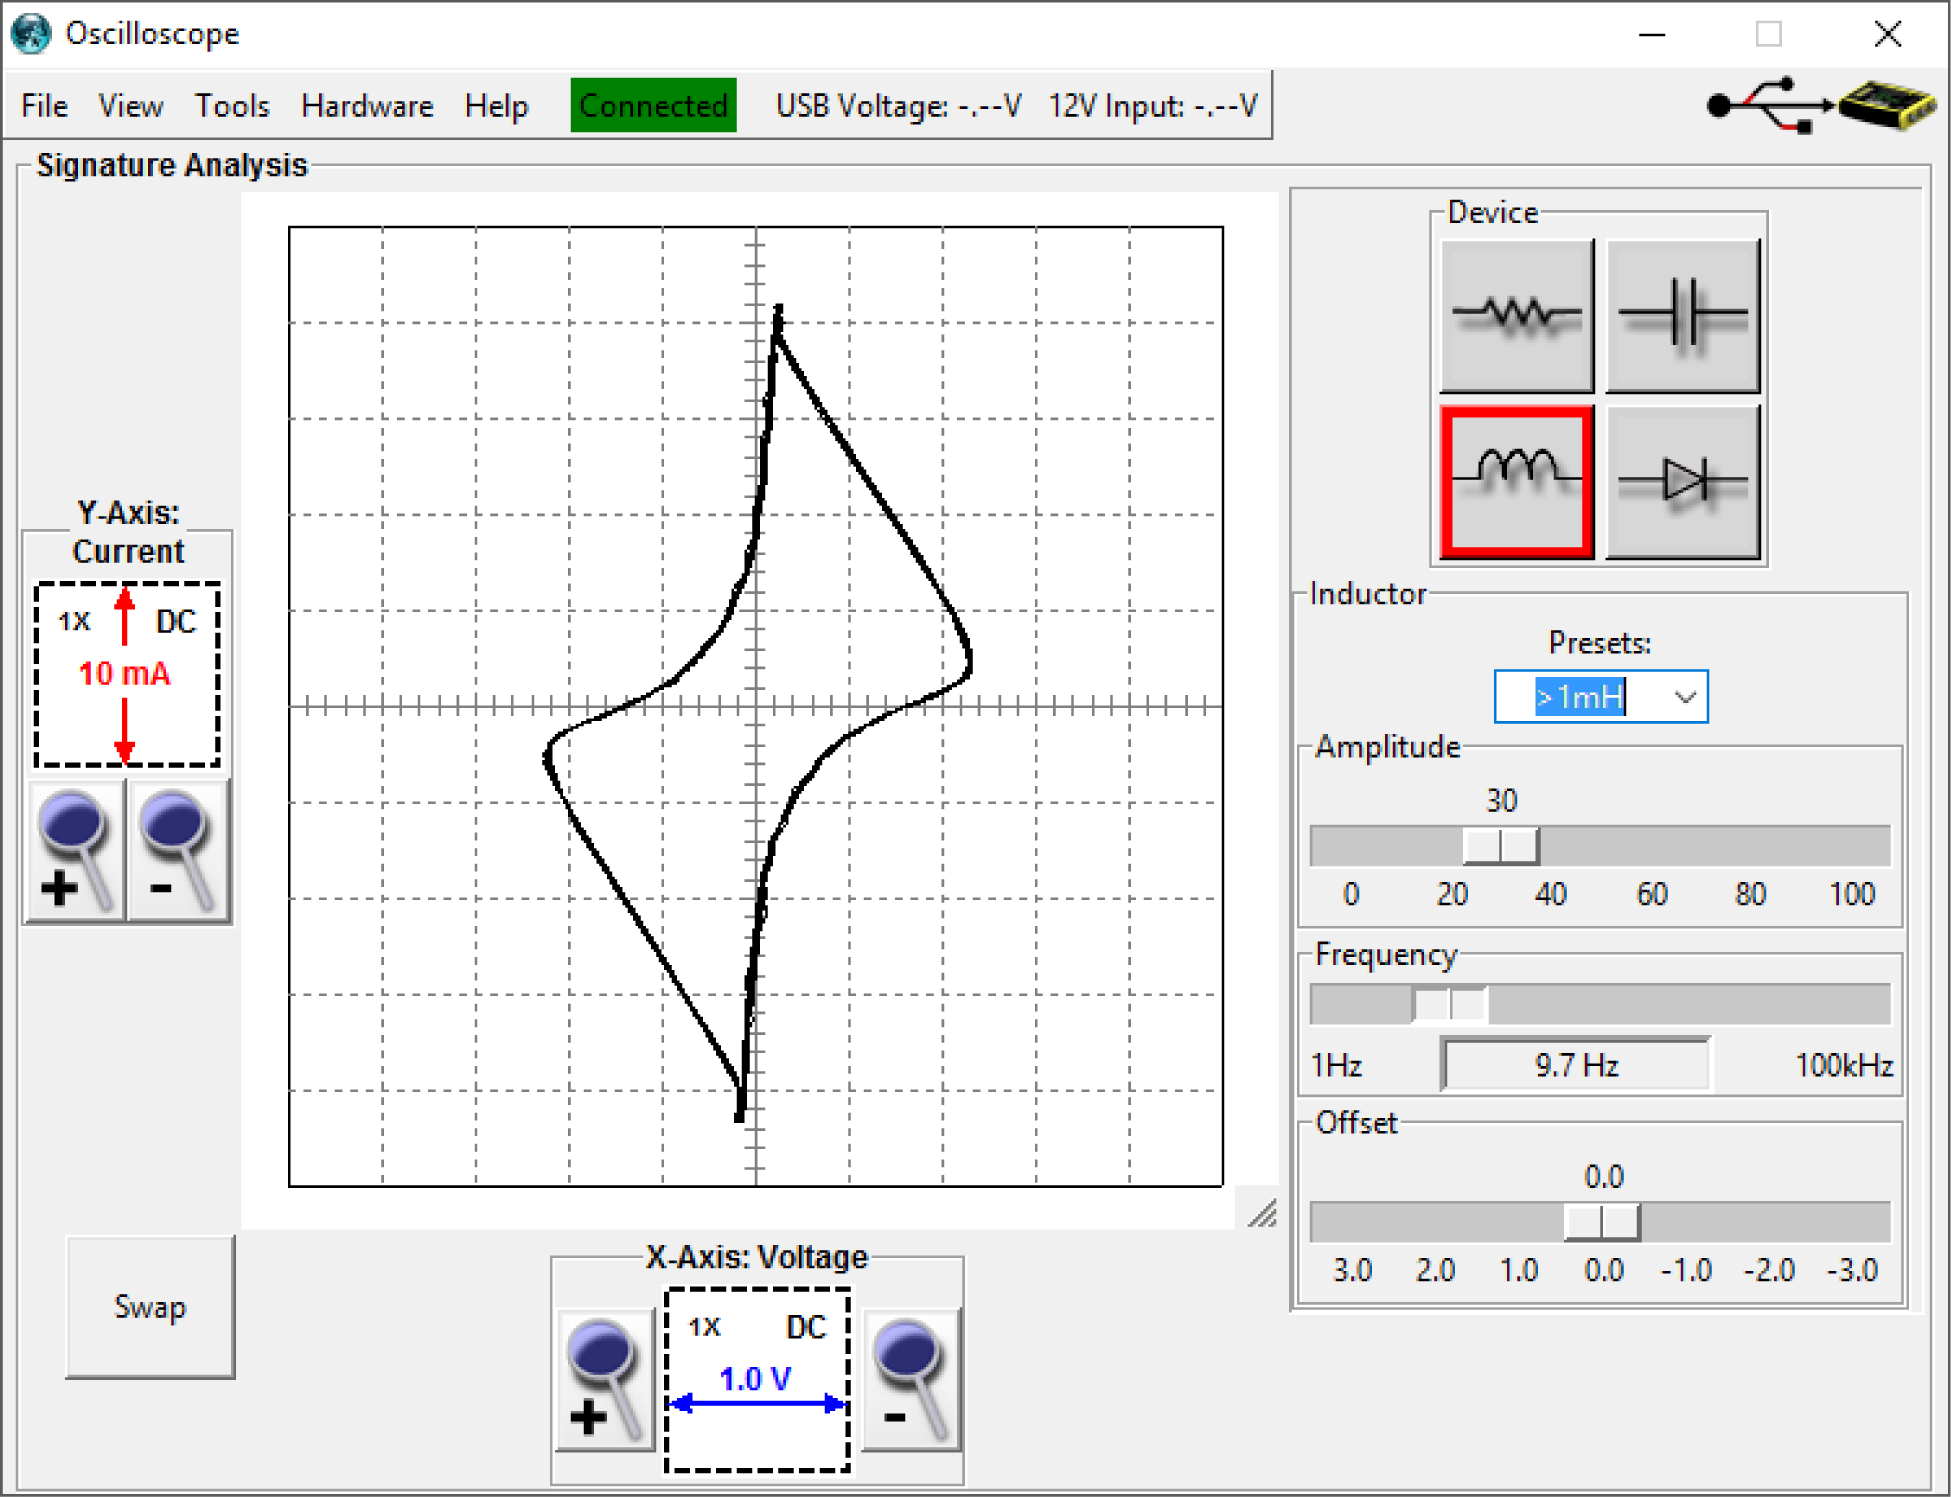
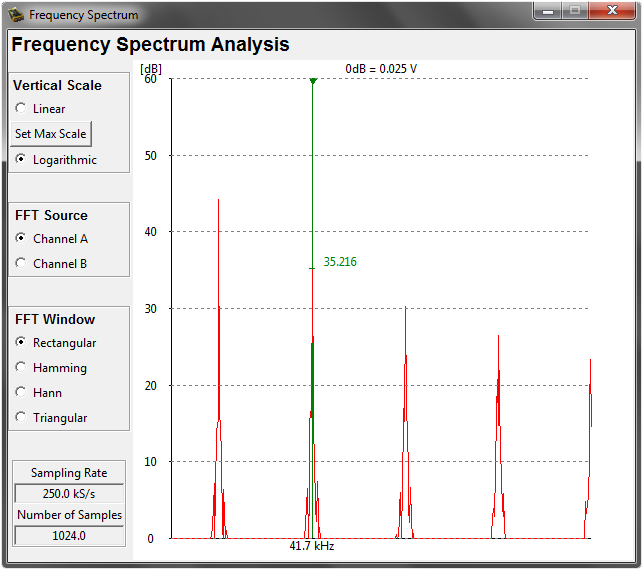
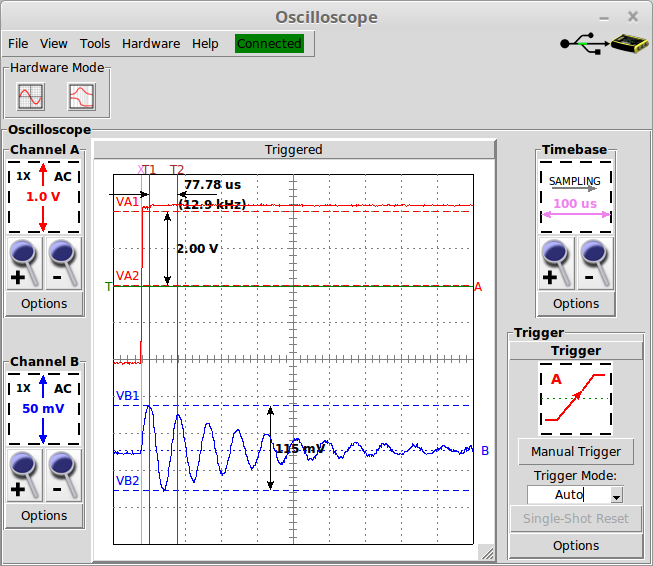
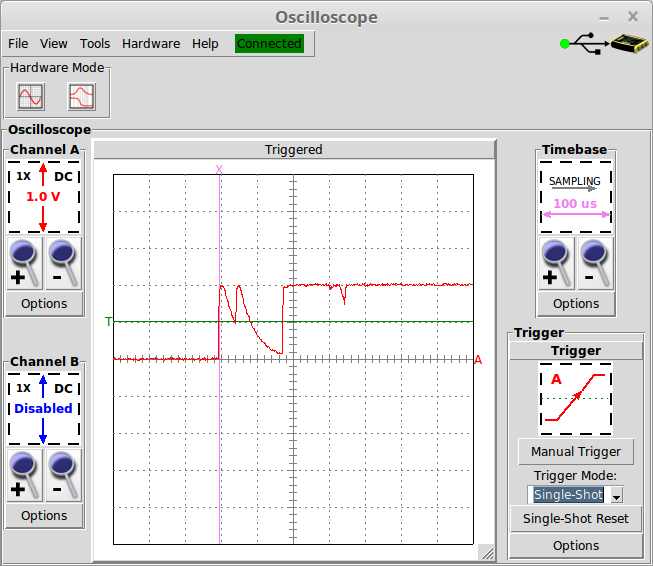
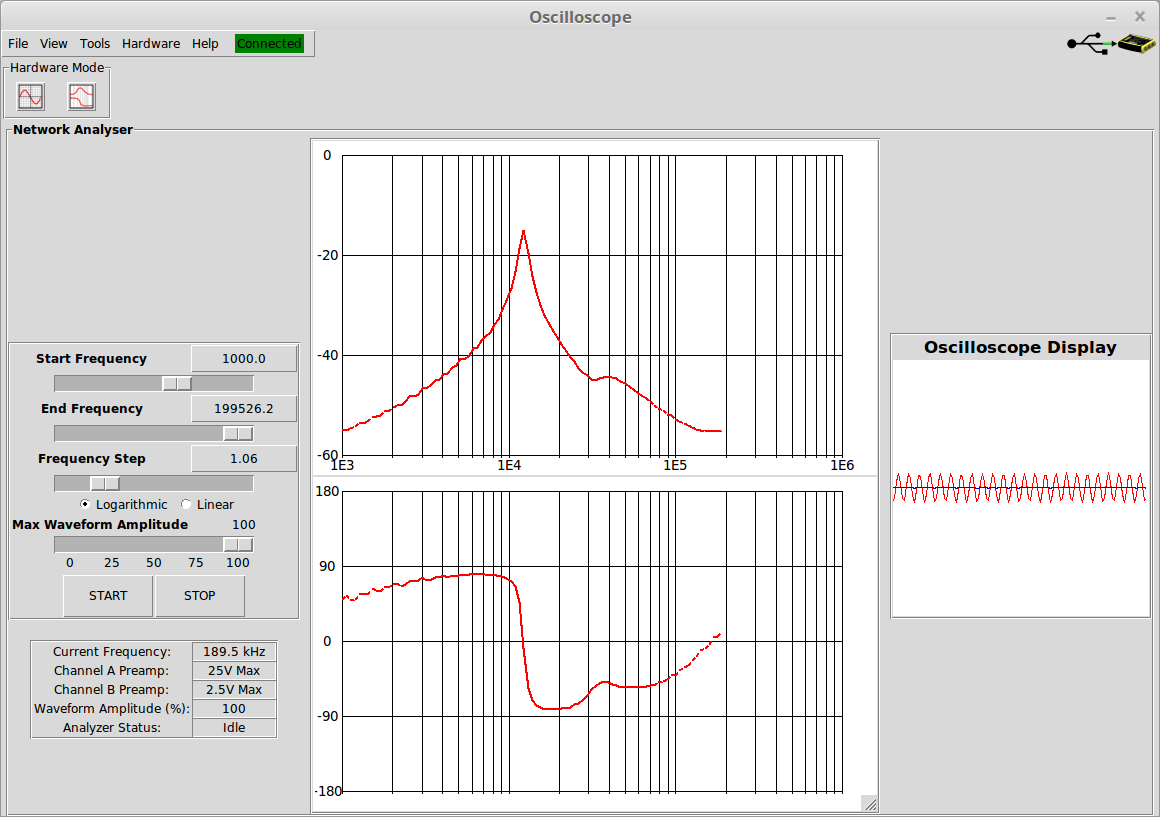
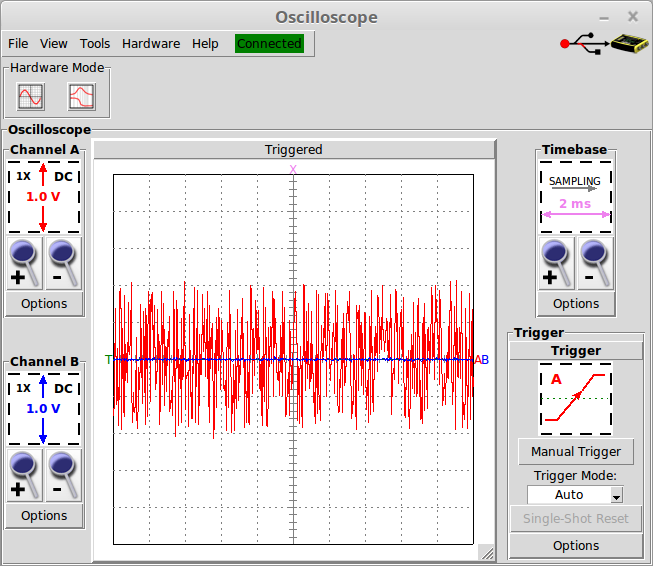
Analog signature analysis was made popular by the Huntron Tracker™ series of instruments.  Signature analysis can be used to perform powered-off troubleshooting of electronic components in printed circuit board assemblies. The SIG-101 Signature Analyzer uses state-of-the-art analog electronics, digital and microprocessor circuits and advanced software to provide six instruments in one small, USB powered package: a calibrated signature analyzer, a 2-Channel, 2MSample/sec digital storage oscilloscope, a 200kHz arbitrary waveform generator, an 8 bit digital input-output port, a vector network analyser (Bode Plotter) and a digital spectrum analyzer. With an intuitive and convenient user interface, the software is Open Source and runs under Windows, Mac and Linux operating systems.

Universal AC adapter and USB Cable included.


This product is currently out of stock and unavailable.

SKU: SIG-101 Category:

Description

Signature Analyzer

Signature analysis is a technique for fault-finding in electronic circuits. It is most frequently used in a production environment to narrow down a fault in a defective printed-circuit board assembly. The operator probes points on the circuit board. At each point, the instrument displays a characteristic ’signature’, which is a pattern on a display screen. The operator compares the measured signature with the signature from a known-good board. If the signatures do not match, then the board is defective at that point. It is not necessary to refer to a schematic diagram or have a deep understanding of the circuit function, and so this test can be used on boards where there is no technical documentation other than a catalog of the signatures. Distinctive signatures are displayed for open and short circuit, resistor, capacitor, inductor, two-terminal devices (such as a diode) and combinations of these devices. Typical signatures are shown in the figures. The signature analyser applies a voltage to the circuit under test and measures the resulting current. It then plots voltage vs current on the display. For example, if the device under test is a capacitor, the voltage and current are 90 degrees out of phase and the signature is an ellipse. The SIG-101 has a unique circuit that improves the range and accuracy of measurement and simplifies interpretation of the signature. As well, the internal oscilloscope and signal generator can optionally be used for further investigation of the circuit under test. As in all Syscomp instruments, the software is Open Source and runs under Windows, Linux and Mac operating systems. This facilitates incorporation of the SIG-101 into automatic test equipment.

Oscilloscope

The SIG-101 oscilloscope is a dual-channel, 2MSample/sec oscilloscope with 11 bit A/D conversion, digital storage and display. Channels A and B are sampled simultaneously and stored in the oscilloscope memory before being sent for display to the host computer. Triggering is accomplished by digital circuitry so it is precise and consistent. Trigger controls include Mode: Auto, Normal, Single-shot, Manual, Source: A or B, and Slope: Positive or Negative. The time and level of the scope trigger point are continuously adjustable by on-screen cursors so that the operator can display the signal before and after the trigger event. The screenshot shows the on-screen cursors that are available to measure amplitude and time interval. The graphical user interface has been designed to be intuitive with convenient access scope amplitude, timebase and trigger controls along with functions such as variable persistence, signal averaging, XY mode, math and instrument calibration. Without digital averaging, the input noise is in the order of 5mV peak. On a repetitive signal with averaging the input noise is in the order of than 1mV peak. For precision and stability the oscilloscope timebase frequency is derived from a crystal oscillator. The vertical preamplifier is gain-switched to optimize the signal-noise ratio and will accept x1, x10 and x100 scope probes.

Function Generator

The SIG-101 Waveform Generator is a powerful, general purpose signal generator with a user interface that makes it easy and convenient to use. All control settings are accessible from button and slider widget controls - there are no menus or sub-menus. The Frequency control is particularly convenient, with a full range of 0.2Hz to 200kHz, linear or log characteristic. The operator can set lower and upper and frequency limits for the slider, such as 20Hz to 20kHz for audio testing. When precision is important, the operator can enter a frequency value directly. The ability to set maximum and minimum frequency and the frequency output, to 0.1Hz resolution makes the generator useful for testing very narrow band filters or for finding resonance in an electromechanical system. The Sine, Square, Triangle, Sawtooth and Noise waveforms are built-in. The operator can also create an arbitrary waveform. The SIG-101 waveform generator has its own dedicated control panel and can be minimized when not in use. The amplitude and offset are implemented in hardware, so the output waveform is always a full 8 bits.

Arbitrary Waveform Generator

The SIG-101 Waveform Generator has the capability of generating an arbitrary waveform. For example, a car ignition waveform can be used for teaching purposes. An ECG waveform can be used to test a cardiac waveform filter. A SINC pulse can be used for impulse testing. The operator creates the arbitrary waveform using the software tool we provide or a .csv file from a spreadsheet. The arbitrary waveform is a a simple sequence of 256, 8 bit values. The screenshot shows two cycles of an ECG arbitrary waveform. As in the case of built-in waveforms, frequency control is available over full range of 0.2Hz to 200kHz. The operator can set lower and upper and frequency limits for the slider, such as 20Hz to 20kHz for audio testing. When precision is important, the operator can enter a frequency value directly. The amplitude and offset controls also adjust the arbitrary waveform. The ability to set maximum and minimum frequency and the frequency output, to 0.2Hz resolution makes the generator useful for testing very narrow band filters or for finding resonance in an electro-mechanical system. The SIG-101 waveform generator has its own dedicated control panel and can be minimized when not in use. The amplitude and offset are implemented in hardware, so the output waveform is always a full 8 bits.

Digital I/O

On the electronic test bench it is often useful to control various digital signals, putting them in a high or low state as required. It's also useful to have indicators to show the state of various digital signals. The outputs can be controlled by SPDT switches and the inputs provided by LEDs. But this is inconvenient: switches bounce and LEDs require significant current, which may require driver transistors. The SIG-101 digital IO section eliminates the need to construct either of those circuits. There are 8 digital outputs that can be controlled from the user interface, and 8 digital indicators that show the state of some digital circuit. (The inputs are compatible with 3V and 5V logic.) The rear panel connector is 10x2 places that mates with a ribbon cable, or you can socket test leads for individual connections. In a student environment, these outputs and inputs can be used to manually control and display digital signals in a test circuit. For example, the digital IO outputs could be applied to the input of a logic gate, and the output of that gate displayed on an CircuitGear digital IO input. A digital IO output could be used as a manual clock for a counter, and the output of the counter displayed on digital IO inputs. The digital IO is particularly useful in connection with automatic test equipment. A designer can write software, using their preferred language and our Open Source API and source code, to send commands to the digital output lines and read the digital input lines. Combined with commands to read oscilloscope data and control the function generator output, it is possible to create an automatic test system at a very modest cost.

PWM Output

A pulse-width-modulated (PWM) signal is a two-level signal where the duty cycle is changed. PWM is the usual control signal for example in switching power supplies and high efficiency motor drives. Or it can be low pass filtered to provide an adjustable output voltage, thereby functioning as a simple D-A converter. The output voltagce is proportional to the average value of the waveform, which changes with duty cycle. The duty cycle can be adjusted from 0 to 100%, and the frequency from 1Hz to 125kHz. The duty cycle remains fixed as the frequency is changed. (This is not true for some waveform generators, where the duty cycle changes with frequency.) Both the duty cycle and frequency can be adjusted by front panel controls and changed from the host via the software API. The screenshot shows a waveform of 75% duty cycle at a frequency of 253.3 Hz.

Trigger Controls

It is often useful for an instrument to respond to some event by taking a measurement or producing a signal. This event is called a 'trigger' signal. The SIG-101 Mini single-shot capture and display capability provides the same (or better) features as a moderate-speed storage oscilloscope, at a tiny fraction of the size, weight and cost. The trigger controls make this capability convenient and easy to use. The oscilloscope trigger signal starts a trace capture and displays the trace. There are three possible sources for the trigger: a 'manual' pushbutton on the user interface, an external logic signal (via the rear panel connector) and a command generated by the host software. The oscilloscope trigger system will be familiar to anyone who has used a conventional oscilloscope. The scope trigger has a cursor for setting the trigger level and screen position and these additional controls: 'source', 'polarity', and 'mode'. In 'Auto' mode, the scope triggers on a signal if it is available. If not, after a short interval, it triggers a capture event. In 'Normal' mode, the scope triggers on a signal if it is available. If there is no satisfactory trigger signal, the scope waits. In 'Single Shot' mode the scope triggers once and only once for each valid trigger signal. Single shot is reset by actuating the 'Single Shot Reset' button. A 'Manual Trigger' button creates generates a scope trigger signal. This combination of trigger controls makes it straightforward to capture a transient event, such as the bouncing of a mechanical switch. For software control, the software issues a command to 'Arm' the scope. Thereafter, a trigger signal will cause a capture and trace. Manual trigger is also available from software.

Vector Network Analyser

There are many electronic circuits where the amplitude and phase response are important: electronic filters, control systems, audio amplifiers and electro-mechanical systems such as guitar-pickups and loudspeakers. The ability to measure the amplitude response over a range of frequencies is 'Scalar Network Analysis'. The ability to measure both amplitude and phase over a range of frequencies, as in the SIG-101, is referred to as 'Vector Network Analysis (VNA). The amplitude and phase response can be determined point by point at individual frequencies by using the oscilloscope to measure the ratio of output vs input magnitude and phase. This is very tedious to do by hand. The CircuitGear Mini automates this process, at a fraction of the cost of previous instruments. The frequency range is the same as the internal waveform generator: 0.2Hz to 200kHz. The amplitude range is in the order of 60db. The screenshot shows the response of an LC resonant circuit with a peak at 12kHz. The plot confirms theory: the phase response changes abruptly at resonance from +90 degrees to -90 degrees. The VNA can 'zoom in' on a response, showing amplitude and phase details over a small frequency range. In the classroom and development lab, the VNA eliminates the tedium of manual measurements and allows the operator to concentrate on the shape circuit frequency response. It is straightforward to relate component values to the actual behaviour of amplitude and phase, and compare that to the response predicted by simulation.

Noise Generator

A noise signal is useful in testing of audio equipment, in acoustical measurements such as reverberation time, and in correlation-type algorithms to measure impulse and frequency response. The waveform of the SIG-101 noise output is shown in the screenshot. The SIG-101 noise waveform is generated as an arbitrary waveform, a sequence of 256, 8 bit random numbers, clocked at a rate determined by the Frequency control on the waveform generator.

Specifications

Signature Analyzer

Test Voltage+/-10V
12-bit continuous adjustment
Offset+/-10V
12-bit continuous adjustment
Horizontal Voltage Display10mV/div to 5V/div
9 ranges in 1-2-5 sequence
+/-25V max
Test Current+/-50mA max
Vertical Current Display100uA/div to 50mA/div
7 ranges in 1-2-5 sequence
Test Frequency Range0.2Hz to 200kHz
Resolution 0.2Hz
Accuracy 0.2%
Resistance Measurement1 ohm to 80 kohm
Capacitance Measurement100pF to 500mF
Inductance Measurement4uH to 20H

Oscilloscope

Maximum Sampling Rate2MS/s
Analog Bandwidth200 kHz
Input Voltage Span10mV/div to 5V/div
+/-0.25Vpk to +/-25Vpk
Input Ranges9 ranges in 1:2:5 sequence
2 Hardware Ranges
Vertical CalibrationYes, software
Input A/D Resolution11 bit
Input Impedance1Mohm||20pF
Timebase Span500ns/div to 20s/div
Timebase Ranges24 steps in 1:2:5 sequence
TriggerNormal, Auto, Single Shot, External
Trigger PolarityRising and falling
Trigger LevelOn-screen, cursor selectable
Pre-Post Trigger DisplayOn-screen, cursor selectable
ReadoutsAmplitude and timebase cursors
Sample Memory1K points/channel
Display refresh rate> 5 updates/second
InterfaceUSB 2.0
Additional DisplaysStrip Chart Mode
X-Y plot
Spectrum Analysis (FFT)
Histogram
Waveform Math

Waveform Generator

Frequency Range0.2 Hz to 200kHz
Frequency Resolution0.2 Hz
Output Amplitude+/-2.75V
Amplitude ControlHardware (12-bit)
Vertical Resolution8 bits
(Independent of Amplitude)
Offset ControlHardware (12-bit)
Output Impedance150 ohms
Standard WaveformsSine, Square, Triangle, Ramp, Noise
Arbitrary Waveform8 bit resolution, vertical and horizontal

Digital I/O

Inputs8 bits, 3/5 volt, HCMOS
Outputs8 bits, 5 volt, HCMOS
PWMVariable Frequency: 1Hz-125kHz
Variable Duty Cycle: 0-100%
TriggerTrigger Input
Trigger Output

Network Analyser/Bode Plotter

Magnitude Plotting60 dB Range
Phase Plotting+/-180 degrees
Frequency Sweep0.2 Hz to 200kHz
Frequency SteppingLinear or Logarithmic